24/04/19 16:26
Solid commercial momentum drives strong growth in retail service revenues
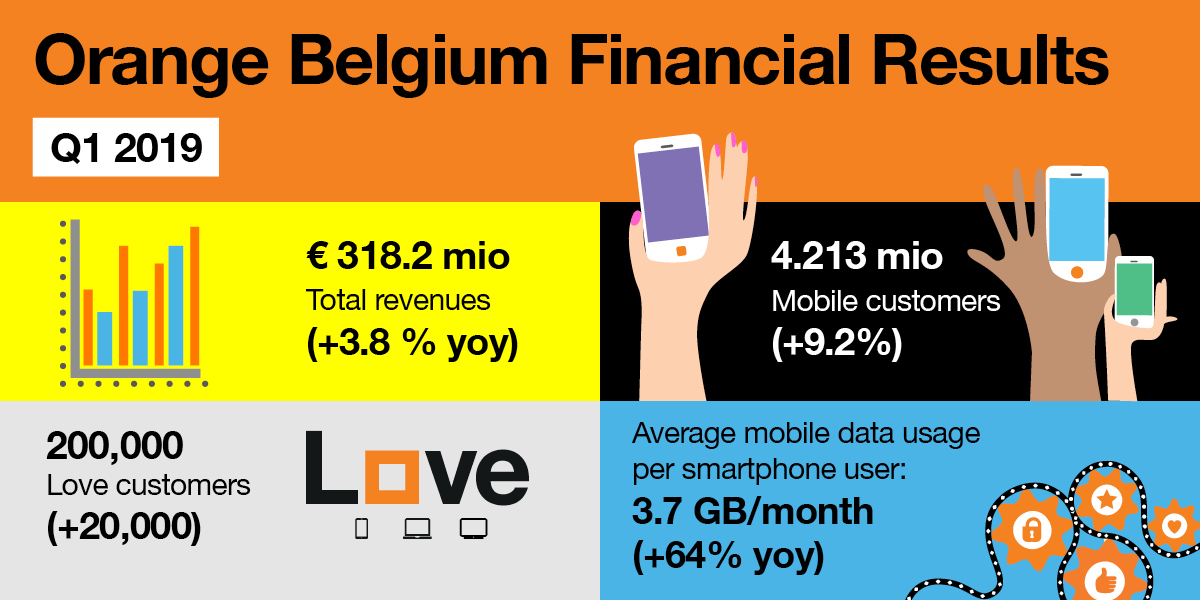
- Mobile postpaid net-adds: + 21k / +53.6% yoy
- Convergence net-adds: +20k / +5.8% yoy
- Revenues: +3.8% yoy / Retail service revenues:+13.5% yoy
- EBITDAaL -3.8% yoy (+14% excluding impact of MVNO revenues)
Q1’19 Belgium operating highlights
- Commercial momentum in mobile postpaid remains solid. The mobile postpaid customer base grew by 21k (+6.9% yoy) to 2.5m subscribers. New customers are increasingly opting for higher tariff plans.
- Convergence net-adds confirms attractiveness of offering. The Love offer remains the best value broadband and TV package in the market. Orange Belgium added 20k subscribers and reached a milestone of 200k Love customers (+64.4% yoy). The convergent mobile subscriber base represents 12.7% of mobile postpaid customers.
- B2C convergent ARPO continued to grow strongly while mobile-only ARPO contracted slightly. B2C convergent ARPO increased 7.7% yoy to €77.4 thanks to the absence of price promotions, revenue from connection fees and the take-up of the fixed line option. Mobile-only postpaid ARPO was 1.1% lighter yoy as growing access revenues did not fully compensate decreasing out-of-bundle revenues.
Orange Belgium: key operating figures
|
|
Q1 2018 |
Q1 2019 |
change |
|
Mobile postpaid customer base (in ‘000) |
2,329 |
2,490 |
6.9% |
|
Net adds qoq (in ‘000) |
14 |
21 |
53.6% |
|
Mobile only postpaid ARPO (€ per month) |
21.1 |
20.8 |
-1.1% |
|
Convergent customer base (in ‘000) |
122 |
200 |
64.4% |
|
Net adds qoq (in ‘000) |
19 |
20 |
5.8% |
|
B2C convergent ARPO (€ per month) |
71.8 |
77.4 |
7.7% |
|
Convergent mobile customer as % mobile contract customer base |
8.0% |
12.7% |
471 bp |
|
|
|
|
|
Q1’19 consolidated financial highlights
- Revenues increased 3.8% yoy to €318.2m. Retail service revenues continued its growth trajectory (+13.5% yoy). Convergence services (+83.4% yoy) and mobile only services (+3.0% yoy) were again the main growth drivers. The loss in MVNO revenues represents €12.1m.
- EBITDAaL was impacted by the loss of Telenet MVNO revenues. EBITDAaL decreased 3.8% yoy against Q1’18 to €58m. Excluding the MVNO impact, EBITDAaL would have increased 14% yoy due to higher revenues and control of direct costs. Once again, Orange Belgium narrowed the cable operations’ EBITDA loss to €1.1m this quarter against a €5.9m loss in Q1’18.
- 2019 financial guidance confirmed. Orange Belgium expects slight revenue growth, EBITDAaL of €285m-€305m and stable eCapex.
Orange Belgium Group: key financial figures
|
|
|||||
|
reported |
comparable |
|
comparable |
reported |
|
|
(in €m) |
Q1 2018 |
Q1 2018 |
Q1 2019 |
change |
change |
|
Revenues |
306.6 |
318.2 |
3.8% |
||
|
Retail service revenues |
181.3 |
205.7 |
13.5% |
||
|
|
|||||
|
EBITDAaL |
N/A |
60.3 |
58.0 |
-3.8% |
|
|
margin |
N/A |
19.7% |
18.2% |
-144 bp |
|
|
eCapex |
-31.8 |
-36.9 |
16.1% |
||
|
Operating cash flow1 |
28.5 |
21.1 |
-25.9% |
||
|
|
|||||
|
Adjusted EBITDA |
60.6 |
|
|||
|
margin |
19.8% |
|
|||
|
Capex |
-31.8 |
|
|||
|
Operating cash flow2 |
28.8 |
|
|||
|
|
|||||
|
Net financial debt |
295.5 |
252.1 |
|||
|
|
|
|
|
|
|
1 Operating cash flow defined as EBITDAaL – eCapex
2 Operating cash flow defined as Adjusted EBITDA –Capex .
Michaël Trabbia, Chief Executive Officer, commented:
At Orange Belgium, we aim to break telco conventions. We disrupted the fixed market duopoly with our Love offers. We were the first to launch full unlimited mobile and convergent offers in Belgium. For the third year in a row we committed not to increase the price of mobile and convergent services.
Our Bold Challenger positioning led to strong commercial growth in 2018. In the first quarter of 2019, in an active competitive environment, we continued to take benefit from this positioning. We experienced solid commercial growth in mobile and convergence, and generated increasing customer satisfaction. We reached the milestone of 200,000 Love customers, and grew our mobile postpaid customer base by nearly 7% yoy. We also launched new initiatives. We extended our unlimited mobile offers to business customers, and guaranteed indoor mobile coverage to our customers. Looking forward, we are preparing the launch of our unlimited Internet-only offer to further address customers’ unmet needs.
Arnaud Castille, Chief Financial Officer, stated:
Our revenues continued to show the steady increase seen since the beginning of 2018, mainly driven by the growth of our retail service revenues, which went up 13.5%, a record figure. It is also worth highlighting that Q1’19 marks the third consecutive quarter of mobile-only revenue growth amidst continued growth in convergence revenues. This is strong evidence that our bold positioning is entrenched in the telecom market.
The termination of MVNO contracts led to a 3.8% contraction of EBITDAaL during the quarter. The impact was €12m on profits which was only partially compensated by a strong growth in retail service revenues.
We confirm our guidance for 2019. We are committed to deliver excellent customer service in order to maintain the commercial momentum. We remain focused on extracting operational efficiencies.
- Key highlights
1.1 Operational highlights
- Orange Belgium launches first fully secured and unlimited business plans to stay connected in Belgium and the EU
Orange Belgium launched the first fully secured and unlimited business plans: unlimited mobile data, voice calls and SMS to use in Belgium as well as in 39 European countries and territories. Orange business customers can stay connected anywhere, anytime, with a complete peace of mind when travelling in the EU as well as making international calls and SMS to the EU. Moreover, an extra security service protects the smartphone of Orange business customers against possible cyber threats.
Since 4 March 2019, Shape Intense and Shape Traveller plans were upgraded to unlimited mobile data and unlimited international voice calls to use in and towards the EU.
- Orange Belgium to allow unlimited data in EU roaming
Orange Belgium improved the Eagle and Eagle Premium mobile plans by removing the 20GB data cap on EU roaming. Since the beginning of April, these customers have unlimited data in the EU and in Belgium. Previously, EU roaming data was billed out-of-bundle when usage exceeded 20GB.
- Orange Belgium announces no Brexit for their mobile customers
Orange Belgium confirmed that business and residential customers traveling to the UK will continue to “roam like home”, regardless of the Brexit outcome.
- Orange Belgium keeps improving its Love experience
Orange Belgium and Eleven Sports signed a new distribution agreement for the 2019/20 and 2020/21 seasons for Eleven Sports 1, 2 and 3. All three channels remain included in HD in Orange´s digital TV package. Starting this summer, subscribers will be able to watch international sporting events on smartphone via the Orange TV app. Today, Orange remains the only telecom operator in Belgium offering Eleven Sports on a standard tariff plan.
The Orange TV app is now compatible with Chromecast and allows customers to watch Live TV on another television set. Additionally, Orange Belgium improved its fast zapping experience, reducing the lag from 3 seconds to less than one when switching between channels. These additional functionalities were implemented at nil cost to customers.
- Medialaan started migrating its mobile subscribers onto Orange Belgium’s network.
Medialaan operates a MVNO under the Mobile Vikings and JIM mobile brand. The migration process is expect to complete during the second quarter.
- Orange Belgium’s networks number 1 for mobile voice, mobile web browsing and most reliable file transfer in Belgium according to LCC
In December 2018, LCC’s European branch conducted an independent performance benchmark measurement, commissioned by Orange, in 22 metropolitan areas of Belgium. The experts at LCC International measured the 3 main voice service operators over 2G and 3G technologies and tested data services on smartphone devices in 2G, 3G, 4G and 4G+.
The results confirmed Orange Belgium as the operator with the best mobile voice experience (94.5% compared to 93.3% and 81.8%), Mobile Web Browsing (87.2% compared to 85.6% and 85%), and most reliable file transfer (up to 99.7% success rate compared to 98.7% and 97.9%) in Belgium.
- Orange Belgium opens a highly secured and eco-efficient data center in Antwerp
On March 18, Orange Belgium inaugurated a data center in Antwerp, in the presence of Philippe Muyters, Minister of Innovation in Flanders. The 1,000 m² facility will help Orange manage the growing mobile usage by handling the billions of day-to-day connections Orange customers make to surf, call and text.
Orange Belgium invested over €14m to build this best-in-class facility. The premises uses freecooling during 98% of the year and is far more energy efficient than a standard data center. The data center is also highly secured and resilient thanks to systematically redundant critical elements.
1.2 Regulatory highlights
- Revision of Broadband and TV distribution market analysis decisions – update
The Court of Appeal rejected the cable operators’ request to suspend the decisions. A decision on the full merits of the cable operator’s appeals is expected mid-2019.
Between December 2018 and February 15, the BIPT launched a consultation on the cost models for wholesale access to cable networks and Proximus' FTTH network.
In its response, Orange Belgium challenged a number of structuring assumptions used in the model - which leads to significantly overestimated costs to deliver services over a cable network. As a result, Orange Belgium called upon to reassess those key assumptions to reflect the financial and technological reality as well as the most likely market evolutions, before using this as an input for the future decisions regarding regulated wholesale tariffs. Orange Belgium now expects a draft decision in Q2 2019 and the final decision in Q4 2019.
- Wholesale high quality access market review
On March 29, the BIPT published a draft analysis of wholesale high-quality access (essentially leased lines). The draft decision finds that Proximus continues to have significant market power in this market. As a result, the draft decision seeks to impose remedies on Proximus. Such remedies include the provision of access at fair and non-discriminatory prices to active high quality access (on fibre and copper) and passive local fibre infrastructure. The access remedies are modulated in function of the specific geographical competitive situation. All players have an opportunity to provide feedback before May 29.
- New spectrum allocation, renewal of existing spectrum attributions
The Royal Decrees regarding the allocation of the 700, 1400 and 3400-3800 MHz band and the renewal/reallocation conditions of the 900, 1800 and 2100 MHz bands were not finalised. The discussion on 5G spectrum licenses and the renewal of the 900-1800 and 2100 MHz licenses is now postponed until after the parliamentary election (May 26, 2019) and the formation of a new government.
- Fixed Termination Rates (FTR)
The BIPT has finalized the FTR decision. On November 23, 2018 the regulator decided to set maximum fixed termination rates (FTRs) at €0.00116/min as of January 1, 2019. 3StarsNet is appealing this decision and the outcome is expected mid-2019.
- Electromagnetic fields standards in Brussels - update
The adoption of the Ordinance to increase the norm, necessary to deploy the 5G in Brussels, was postponed by the Brussels Government.
- Comments on the financial situation
2.1 IFRS 16 implementation
IFRS16 – Leases is applicable from January 1, 2019 and supersedes IAS17. Under IFRS 16, a lease is defined as a “contract that conveys the right to control the use of an identified asset for a period of time in exchange for consideration”. Orange Belgium applied a “modified retrospective” transition approach which is consistent with Orange Group’s accounting policy. This means on-going lease contracts are treated as if they started on January 1, 2019 and the periods prior to 2019 are not restated for IFRS16.
The main impact of IFRS16 relate to:
- Lease commitments: these liabilities were previously disclosed off-balance sheet in the notes to the consolidated financial statements. Under IFRS16, they will be recorded on the balance sheet 1) as Right of Use assets on the asset side with the valuation approach required by IFRS16, and 2) on the liability side.
- Lease operating expense: this expense was included within indirect costs. Under IFRS16, this expense is replaced by an amortization charge and an interest expense.
- Additional disclosure: the notes to the financial statements will include greater disclosure especially regarding the nature of the leases and their evolution.
IFRS 16 implementation also implies changes to the way Orange Belgium reports financials
- EBITDAaL: EBITDA after Leases is a measure of financial profitability that includes the amortization charge and interest expense relating to leases. This metric supersedes Adjusted EBITDA.
- eCapex: Orange Group is introducing an economic Capex as a measure of capital investments, which for Group-purposes, matches actual cash capital investments. With regards to Orange Belgium, there is no difference between eCapex and the Capex given that the disposals of fixed and intangible assets are limited in scope.
2.2 Consolidated figures for the Orange Belgium Group
Orange Belgium Group: consolidated P&L
|
|
reported |
comparable |
|
comparable |
reported |
|
(in €m) |
Q1 2018 |
Q1 2018 |
Q1 2019 |
change |
change |
|
Revenues |
306.6 |
|
318.2 |
|
3.8% |
|
Belgium |
295.2 |
|
305.5 |
|
3.5% |
|
Luxembourg |
15.4 |
|
16.2 |
|
5.3% |
|
Intra-group eliminations |
-4.0 |
|
-3.5 |
|
-14.0% |
|
|
|
|
|
|
|
|
EBITDAaL |
|
60.3 |
58.0 |
-3.8% |
|
|
Belgium |
59.3 |
56.4 |
-4.9% |
|
|
|
Luxembourg |
1.0 |
1.6 |
63.5% |
|
|
|
EBITDAaL margin |
|
19.7% |
18.2% |
-144 bp |
|
|
|
|||||
|
Adjuted EBITDA |
60.6 |
|
|
|
|
|
Belgium |
59.6 |
|
|
||
|
Luxembourg |
1.0 |
|
|
||
|
Adjusted EBITDA margin |
19.8% |
|
|
|
|
|
|
|||||
|
Restructuring costs |
-1.4 |
-4.6 |
|||
|
Other operating income |
0.0 |
0.0 |
|||
|
Depreciation and amortization |
-57.7 |
-60.8 |
|||
|
Impairment of goodwill |
0.0 |
0.0 |
|||
|
Share of profits (losses) of associates |
0.0 |
0.0 |
|||
|
EBIT |
1.6 |
|
-7.4 |
|
|
|
|
|||||
|
Financial income |
0.0 |
0.0 |
|||
|
Financial expense |
-1.1 |
-1.1 |
|||
|
Profit before tax |
0.5 |
|
-8.5 |
|
|
|
|
|||||
|
Tax expense |
-0.9 |
0.1 |
|||
|
|
|||||
|
Net profit |
-0.4 |
-8.3 |
|||
|
EPS (€) |
-0.01 |
-0.14 |
|||
|
# of shares (m) |
59.82 |
59.84 |
|||
|
|
|
|
|
|
|
2.3 Consolidated statement of comprehensive income
Revenues
Group revenues grew 3.8% to €318.2m. Retail service revenues increased 13.5% to €205.7m on robust revenue growth in mobile services and continued strong momentum in convergence. Wholesale revenues declined 13.7% because of the expected lower MVNO revenues. MVNO revenues were €0.4m in the quarter versus €12.1m in the comparable period in 2018.
Orange Belgium Group: consolidated revenues
|
(in €m) |
Q1 2018 |
Q1 2019 |
change |
|
Convergent service revenues |
20.8 |
38.1 |
83.4% |
|
Mobile only service revenues |
149.9 |
154.4 |
3.0% |
|
Fixed only service revenues |
9.7 |
12.2 |
24.9% |
|
IT & Integration Service |
0.9 |
1.0 |
19.6% |
|
Retail service revenues |
181.3 |
205.7 |
13.5% |
|
Equipment sales |
32.2 |
31.4 |
-2.5% |
|
Wholesale revenues |
77.4 |
66.8 |
-13.7% |
|
of which Incoming & Visitor Roaming |
59.3 |
61.4 |
3.5% |
|
Other revenues |
15.8 |
14.4 |
-8.9% |
|
Revenues |
306.6 |
318.2 |
3.8% |
|
|
|
|
|
Result of operating activities before depreciation and other expenses
EBITDAaL decreased 3.8% to €58m. Excluding the impact from MVNO revenues, the underlying EBITDAaL would show a 14% improvement as efficiency measures take hold. The cable operations’ EBITDA loss was €1.1m this quarter against a €5.9m loss in Q1’18.
Total operational expenses reached €260.2m in Q1’19 (+5.8%) compared to €246.0m in the previous year. The following table provides an overview of the different expenses.
Operating costs
|
(in €m) |
Q1 2018 |
Q1 2019 |
change |
|
Directs costs |
-144.3 |
-145.3 |
0.7% |
|
Labor costs |
-36.1 |
-36.9 |
2.2% |
|
Indirect costs |
-65.6 |
-78.0 |
18.9% |
|
|
-246.0 |
-260.2 |
5.8% |
|
|
|
|
|
- Direct costs remained stable at €145.3m. Higher cable access and content costs (due to an increase in customer base) were offset by lower interconnection costs, customer equipment costs and commissions.
- Labor costs grew 2.2% to €36.9m.
- Indirect costs increased 18.9% to €78.0m as a result of the strong commercial growth and an increase in provisions for operating taxes. Costs related to IT & Network, property expenses and spectrum fees were the main driver of the increase. As a result of a stricter interpretation of IFRIC21 guidance, the company took a greater provision charge for operating taxes and levies. The higher provision is a reflection of a seasonality as the full-year cost will remain stable.
Restructuring costs for the quarter amounted to €4.6m.
Non-recurring items
|
(in €m) |
Q1 2018 |
Q1 2019 |
change |
|
Restructuring costs |
-1.4 |
-4.6 |
225.4% |
|
Other operating income |
0.0 |
0.0 |
NM |
|
|
-1.4 |
-4.6 |
225.6% |
|
|
|
|
|
Depreciation and amortization
Depreciation and amortization increased from €57.7m to €60.8m.
Financial result
Net financial expenses were comparable to the previous year and amounted to €1.1m
Taxes
The group reported a tax credit of €0.1m in Q1’19 due to its pre-tax loss. In Q1’18, the group had a tax expense of €0.9m.
Net profit
Orange Belgium reported a net loss of €8.3m during the quarter. Lower EBITDAaL, higher restructuring costs and higher depreciation charges contributed to a greater loss compared to a €0.4m loss in Q1’18.
2.4 Liquidity and capital resources
The Group uses Operating cash flow and Organic cash flow as the main metrics for analysing cash generation. Operating cash flow is defined as EBITDAaL less eCapex. Organic cash flow measures the net cash provided by operating activities, less eCapex, plus proceeds from the disposal of tangible and intangible assets.
Operating cash flow decreased from €28.5m to €21.1m due to higher network and cable eCapex. Cable-related eCapex increased from €10.5m to €12.3m due to higher convergence subscriber net-adds.
Organic cash flow decreased from €19.9m to €12.5m in Q1’19 due to lower eCapex related payables.
Reconciliation to free cash flow and organic cash flow
|
(in €m ) |
Q1 2018 |
Q1 2019 |
|
Net profit |
-0.4 |
-8.3 |
|
Tax expense |
0.9 |
-0.1 |
|
Net financial expense |
1.1 |
1.1 |
|
Share of profits (losses) of associates and joint ventures |
0.0 |
0.0 |
|
Impairment of goodwill |
0.0 |
0.0 |
|
Depreciation, amortization & impairment |
57.7 |
60.8 |
|
Other adjustments |
1.4 |
4.6 |
|
|
||
|
EBITDAaL |
|
58.0 |
|
eCapex |
-36.9 |
|
|
Operating cash flow |
|
21.1 |
|
|
||
|
Adjusted EBITDA |
60.6 |
|
|
Capex |
-31.8 |
|
|
Operating cash flow |
28.8 |
|
|
|
||
|
Adjustments for non-cash items |
-8.1 |
24.7 |
|
Change in working capital |
20.1 |
9.4 |
|
Other net cash out |
-11.8 |
-8.4 |
|
Increase (decrease) in fixed assets payables |
-9.1 |
-23.5 |
|
Disposal of property, plant and equipment and intangible assets |
0.0 |
0.0 |
|
Repayment of lease liabilities |
0.0 |
-10.9 |
|
Organic cash flow |
19.9 |
12.5 |
|
|
|
|
Net debt at the end of quarter stood at €252.1m, compared to €264.3m at the end of 2018. Gearing, as measured by the net debt/EBITDAaL ratio, remained stable at 0.9x.
Net debt
|
(in €m ) |
Q4 2018 |
Q1 2019 |
|
Non-current financial debt |
270.0 |
269.9 |
|
Current financial debt |
20.8 |
7.3 |
|
290.9 |
277.2 |
|
|
Cash and cash equivalents |
-26.6 |
-25.2 |
|
Net financial debt |
264.3 |
252.1 |
|
|
||
|
Net debt/EBITDAaL |
0.9x |
0.9x |
|
|
|
|
2.5 Activities of the Orange Belgium Group by segment
The following gives a breakdown of Orange Belgium Group’s activities in greater detail:
2.5.1. Orange Belgium
Operating review
Convergent services
Orange Belgium’s growth momentum in convergence continued in Q1’19. During the quarter, the Love offer attracted 20,000 new subscribers to reach a milestone of 200,000 Love customers. B2C customers represent 90% of convergence subscriber base.
Orange Belgium: convergent services operating figures (in ‘000s, unless otherwise indicated)
|
Q1 2018 |
Q1 2019 |
change |
|
Q1 2018 |
Q1 2019 |
|
|
Convergent customer base |
|
|
Net-adds |
|
|
|
|
B2C convergent customer base |
110 |
180 |
63.0% |
B2C convergent customer base |
17 |
18 |
|
B2B convergent customer base |
11 |
20 |
78.1% |
B2B convergent customer base |
2 |
2 |
|
122 |
200 |
64.4% |
19 |
20 |
||
|
|
|
|
|
|||
|
ARPO (in € per month) |
|
|
|
|
||
|
B2C convergent |
71.8 |
77.4 |
7.7% |
|
|
|
|
|
|
|
|
|
|
|
Orange Belgium launched the Love convergence offer in Q2’16. It reached its first 100k customers after 2 years. Thanks to its commercial momentum that started in 2018 boosted by the bold positioning, Orange Belgium was able to reach the milestone of 200k customers in 4 quarters. This result was achieved without any promotional activities, a continuing improvement of the service and no price increases.
Orange Belgium added 29k B2C mobile convergent customers to reach a customer base of 272k. The B2C convergent ARPO increased 7.7% to €77.4 in Q1’19. On the B2B mobile convergent segment, the customer base increased to 44k.
Mobile services
Orange Belgium maintained a stellar commercial momentum during the quarter.
The company achieved net-adds of 21k subscribers (Q1’18: +14k subscribers) in the postpaid segment, a feat considering the loss of a sizeable B2B customer. The latter represents a loss of 11k subscribers in Q1’19 and is expected to port out a further 10k subscribers in the next quarter. The postpaid customer base increased by 6.9% to 2.5 million while the prepaid customer base decreased by 3.5%.
Postpaid mobile ARPO retreated by 1.1% to €20.8 in the first quarter of 2019. Growing access revenues partially mitigated lower out-of-bundle revenues. Prepaid ARPO dropped 6.6% to €6.6 in the first quarter of 2019.
Orange Belgium: mobile services operating figures (in ‘000s, unless otherwise indicated)
|
Q1 2018 |
Q1 2019 |
change |
|
Q1 2018 |
Q1 2019 |
|
|
Mobile customers (excl. MVNOs) |
|
|
Net-adds |
|
|
|
|
Postpaid |
2,329 |
2,490 |
6.9% |
Postpaid |
14 |
21 |
|
Prepaid |
582 |
561 |
-3.5% |
Prepaid |
0 |
-6 |
|
M2M |
946 |
1,161 |
22.8% |
M2M |
-4 |
48 |
|
3,857 |
4,213 |
9.2% |
10 |
63 |
||
|
|
|
|
|
|||
|
Mobile customers (excl. MVNOs) |
|
|
Net-adds |
|
|
|
|
B2C convergent (excl. mobile broadband) |
163 |
272 |
67.2% |
B2C convergent (excl. mobile broadband) |
26 |
29 |
|
Mobile only |
3,694 |
3,940 |
6.7% |
Mobile only |
-24 |
35 |
|
- Postpaid |
2,166 |
2,218 |
2.4% |
- Postpaid |
-12 |
-7 |
|
of which B2B convergent mobile customers |
24 |
44 |
88.1% |
of which B2B convergent mobile customers |
5 |
5 |
|
- Prepaid |
582 |
561 |
-3.5% |
- Prepaid |
-8 |
-6 |
|
- M2M |
946 |
1,161 |
22.8% |
- M2M |
-4 |
48 |
|
3,857 |
4,213 |
9.2% |
2 |
63 |
||
|
|
|
|||||
|
MVNO customers |
208 |
10 |
-95.0% |
|
||
|
|
|
|||||
|
Mobile only ARPO (€ per month) |
|
|
||||
|
Blended |
18.1 |
18.0 |
-0.8% |
|
|
|
|
Postpaid |
21.1 |
20.8 |
-1.1% |
|
|
|
|
Prepaid |
7.0 |
6.6 |
-6.6% |
|
|
|
|
|
|
|
|
|
|
|
Financial review
Revenues in Belgium grew 3.5% to €305.5m as convergence continued to grow and mobile services grew for a third consecutive quarter.
During Q1’19, retail service revenues maintained its growth path. Retail service revenues increased 13.1% to €194.5m due to sustained uptake of convergent services. Convergent services revenues continued its spectacular growth trajectory in the first quarter with a year-on-year increase of 83.4%. This growth stems from the sustained uptake of customers opting for Orange Belgium’s Love offer, resulting in both an increase of the cable broadband and digital TV customer base, as well as an increase of convergent mobile customers. Mobile-only service revenues were stable on a quarterly and full year-basis.
Equipment sales grew 2.4% to €29.0m in Q1’19.
Wholesale revenues decreased 14.4% to €65.2m due to the expected drop in MVNO revenues. Wholesale services generated €0.4m of revenues from MVNOs. For reference, in Q1’18, Telenet represented €10m of the €12.1m generated from MVNO revenues during that quarter.
Orange Belgium: key financial figures
|
|
reported |
comparable |
|
comparable |
reported |
|
(in €m) |
Q1 2018 |
Q1 2018 |
Q1 2019 |
change |
change |
|
Convergent service revenues |
20.8 |
|
38.1 |
83.4% |
|
|
Mobile only service revenues |
142.2 |
|
145.5 |
2.3% |
|
|
Fixed only service revenues |
8.1 |
|
9.9 |
22.5% |
|
|
IT & Integration service revenues |
0.9 |
|
1.0 |
19.6% |
|
|
Retail service revenues |
171.9 |
|
194.5 |
13.1% |
|
|
Equipment sales |
28.3 |
|
29.0 |
2.4% |
|
|
Wholesale revenues |
76.2 |
|
65.2 |
-14.4% |
|
|
Other revenues |
18.9 |
|
16.8 |
-11.2% |
|
|
Revenues |
295.2 |
|
305.5 |
3.5% |
|
|
|
|
|
|||
|
EBITDAaL |
|
59.3 |
56.4 |
-4.9% |
|
|
margin |
|
20.1% |
18.5% |
-163 bp |
|
|
Adjusted EBITDA |
59.6 |
|
|
||
|
margin |
20.2% |
|
|
||
|
|
|
|
|
|
|
EBITDAaL decreased 4.9% due to the loss of the revenues from the Telenet MVNO contract. Despite revenue growth, the EBITDAaL loss of its cable business narrowed to €1.1m due to better industrialization and lower churn. For comparison purposes, the unit recorded a loss of €5.9m in Q1’18 and €1.5m in Q4’18.
2.5.2. Orange Communications Luxembourg
Operating review
In spite of a MVNO folding operations late last year, competition in the mobile market is intensifying. The incumbent Tango is heavily promoting its new tariff plans which feature zero-rated data on a wide variety of OTT applications. JOIN, a MVNO which is majority-owned by POST Luxembourg, relaunched with no commitment plans. Within this context, Orange Communications Luxembourg stabilized its mobile subscriber base at 194k. Blended mobile ARPO increased 6.9% to €28.0 because of an improved sales mix which increased postpaid mobile ARPO by 8.8%.
Orange Communications Luxembourg: mobile services operating figures
|
|
Q1 2018 |
Q1 2019 |
change |
|
Q1 2018 |
Q1 2019 |
|
Mobile customers (excl. MVNOs) |
|
|
Net-adds |
|
|
|
|
Postpaid |
110 |
111 |
1.5% |
Postpaid |
2 |
2 |
|
Prepaid |
11 |
13 |
22.8% |
Prepaid |
0 |
1 |
|
M2M |
73 |
70 |
-4.8% |
M2M |
8 |
-1 |
|
194 |
194 |
0.3% |
11 |
2 |
||
|
|
|
|
|
|||
|
Mobile customers (excl. MVNOs) |
|
|
Net-adds |
|
|
|
|
B2C convergent (excl. mobile broadband) |
4 |
5 |
B2C convergent (excl. mobile broadband) |
0 |
0 |
|
|
Mobile only |
190 |
190 |
-0.1% |
Mobile only |
10 |
2 |
|
- Postpaid |
106 |
107 |
0.8% |
- Postpaid |
2 |
1 |
|
- Prepaid |
11 |
13 |
22.8% |
- Prepaid |
0 |
1 |
|
- M2M |
73 |
70 |
-4.8% |
- M2M |
8 |
-1 |
|
194 |
194 |
0.3% |
11 |
2 |
||
|
|
|
|||||
|
MVNO customers |
2 |
3 |
8.2% |
|
|
|
|
|
|
|||||
|
Mobile only ARPO (€ per month) |
|
|
||||
|
Blended |
26.2 |
28.0 |
6.9% |
|
|
|
|
Postpaid |
28.2 |
30.7 |
8.8% |
|
|
|
|
Prepaid |
6.2 |
5.7 |
-8.9% |
|
|
|
|
|
|
|
|
|
|
|
Financial review
Revenues grew 5.3% to €16.2m . Retail services continued to perform strongly with revenues increasing 19.5% to €11.2m. Mobile-only services was the main growth driver (+15.8%) as an improved customer mix contributed to a 6.9% growth in mobile postpaid ARPO.
EBITDAaL increased 63.5% to €1.6m. The improvement is due to higher revenues and stable operating costs.
Orange Communications Luxembourg: key financial figures
|
|
reported |
comparable |
|
comparable |
reported |
|
(in €m) |
Q1 2018 |
Q1 2018 |
Q1 2019 |
change |
change |
|
Mobile only service revenues |
7.7 |
|
8.9 |
15.8% |
|
|
Fixed only service revenues |
1.7 |
|
2.3 |
36.2% |
|
|
IT & Integration service revenues |
0.0 |
|
0.0 |
||
|
Retail service revenues |
9.4 |
|
11.2 |
19.5% |
|
|
Equipment sales |
3.9 |
|
2.4 |
-38.0% |
|
|
Wholesale revenues |
2.0 |
|
2.4 |
21.8% |
|
|
Other revenues |
0.2 |
|
0.2 |
32.9% |
|
|
Revenues |
15.4 |
16.2 |
5.3% |
||
|
|
|
|
|||
|
EBITDAaL |
|
1.0 |
1.6 |
63.5% |
|
|
margin |
|
6.5% |
10.1% |
359 bp |
|
|
Adjusted EBITDA |
1.0 |
|
|
||
|
margin |
6.5% |
|
|
||
|
|
|
|
|
|
|
- Financial risks and risk management
There were no change to the information disclosed on p.73-74 and p.114-115 in the 2018 annual report.
- Disputes
Telecom masts
Since 1997, certain municipalities and four provinces have adopted local taxes, on an annual basis, on pylons, masts or antennas erected within their boundaries. Orange Belgium continues to file fiscal objections against each tax assessment notice received concerning these taxes. These taxes are currently being contested in Civil Courts (Courts of First Instance - Tax Chamber and Courts of Appeal).
On 22 December 2016, the three mobile operators concluded an agreement in principle with the Walloon government on the issue of taxing mobile infrastructure in the Walloon region for the period 2016-2019 and agreed to settle the dispute on the Walloon regional taxes for 2014.
Over a 4 year period (2016-2019), Orange Belgium commits to pay €16.1m and to invest €20m on incremental telecom infrastructure in the Walloon region. In return, the Walloon Region commits to: i) no longer levy taxes on telecom infrastructure; ii) implement a legislative, regulatory and administrative framework designed to facilitate the deployment of such infrastructure; and iii) discourage municipalities and provinces from taxing telecom infrastructure. In 2018, several Walloon municipalities and provinces levied taxes on telecom infrastructure.
The operators will be entitled to deduct such local taxes levied in 2016-2019 by Walloon municipalities or provinces from the 2019 settlement and investment amounts.
Regulation of broadband and cable
On 30 January 2019 the Court of appeal refused the cable operators’ request to temporarily (partially) suspend the market analysis decision until a final judgment of the EU General Court would be obtained. Subsequently, Telenet decided in February 2019 to withdraw its attack before the EU General Court. Following this, the Court of appeal fixed a new calendar for briefs exchanges for the appeal on the merits, and pleadings are now foreseen end May 2019.
Access to Telenet’s cable network – own channel
The pleadings before the Court of appeal have taken place in March 2019 and a judgment is expected in the second quarter of 2019.
Access to Telenet’s cable network – own internet profile
On 7 March 2019 Orange Belgium initiated legal proceedings before the Enterprise Court against Telenet and claimed damages for the non-provision of an own profile by Telenet (a wholesale service imposed on the cable operators by the market analysis decisions of 2011). A calendar for briefs exchanges has been set up and pleadings are foreseen at the end of 2019 – early 2020.
Fixed termination rates (FTR)
In January 2019 3StarsNet attacked the BIPT decision of 20 November 2018 on wholesale tariffs for call termination on fixed public telephone networks (FTR). 3Starsnet asks the suspension and annulment of the FTR-decision criticizing i.a. lack of essential formalities in the adoption of the decision and the risk on their business when the new lower rates apply. Orange Belgium intervenes to support the BIPT decision. On 6 March 2019, the Court of Appeal rejected 3StarsNet’s suspension request. Briefs regarding the appeal on the merits must now be exchanged, pleadings are foreseen in May 2019.
Lycamobile
On 19 February 2016, Lycamobile Belgium Limited and Lycamobile BVBA initiated legal proceedings against Orange Belgium (previously Mobistar) before the Brussels Commercial Court claiming damages for the alleged belated commercial launch of Lycamobile’s 4G services. The case was heard on 10 March 2017. By judgement on 12 May 2017, the Brussels Commercial Court dismissed the claim and ordered Lycamobile to pay Orange Belgium €18,000 as compensation for procedural costs. The judgement was served on 3 July 2017 and Lycamobile paid the full amount. On 11 August 2017, Lycamobile filed an appeal before the Brussels Court of Appeal. An introductory hearing took place on 21 September 2017 and a calendar for the filing of trial briefs was set. Parties have exchanged trial briefs. No pleading date has been set.
Euphony Benelux NV in bankruptcy
On 2 April 2015, Orange Belgium was summoned by the receivers of Euphony Benelux NV to a hearing on 17 April 2015 at the Brussels Commercial Court. The bankruptcy receivers claim that Orange Belgium should pay a provisional amount of one (1) euro for overdue commissions as well as an eviction fee. In this context, the bankruptcy receivers claim that Orange Belgium should submit all relevant documents to allow the bankruptcy receivers to calculate the amounts claimed.
On 17 April 2018, the Court dismissed the claim relating to the eviction fee and appointed an expert for the claim relating to the overdue commissions. Orange Belgium has filed an appeal at the Brussels Court of Appeals. An introductory hearing took place and the Court of Appeals has set a calendar for the filing of trial briefs. Both parties are currently exchanging trial briefs.
- Significant event after the end of the fourth quarter of 2018
No other significant events occurred after the end of the first quarter of 2019.
- Outlook
Based on Q1’19 results, Orange Belgium reiterates the financial outlook provided in February. Orange Belgium expects slight growth in revenues in 2019 taking into account further uptake on its postpaid and convergent customer base.
For 2019, the Company expects an EBITDAaL (under IFRS16) between €285m and €305m. This range takes into account headwinds such as the decrease in MVNO revenues, the international call impact due to the new regulation and the payment of the Orange branding fee as from May. As a reminder, the Company expects cable operations to achieve EBITDAaL breakeven by year-end. Lastly, total eCapex is expected to remain stable.
- 2019 Financial calendar
1 April Start of quiet period
24 April Financial results Q1 2019 (7:00 am CET) – Press release
24 April Financial results Q1 2019 (10:00 am CET) – Audio conference call
02 May Annual General Meeting of Shareholders
14 May Ex-dividend date*
15 May Record date dividend*
16 May Payment date dividend*
1 July Start of quiet period
24 July Financial results Q2 2019 (7:00 am CET) – Press release
24 July Financial results Q2 2019 (2:00 pm CET) – Audio conference call/webcast
1 October Start of quiet period
23 October Financial results Q3 2019 (7:00 am CET) – Press release
23 October Financial results Q3 2019 (10:00 am CET) – Audio conference call
* subject to AGM approval
This is a preliminary agenda and is subject to changes
- Conference call details
Date: 24 April 2019
Time: 10:00 (CET), 9:00 (UK), 04:00 (US/NY)
Conference call: Orange Belgium Q1 19 results
Please aim to access the conference call ten minutes prior to the scheduled start time.
- Shares
Share trading volumes and closing prices are based on trades made on NYSE Euronext Brussels.
|
|
Q1 2018 |
Q1 2019 |
|
Trading of shares |
|
|
|
Average closing share price (€) |
16.1 |
17.7 |
|
Average daily volume |
73,805 |
66,232 |
|
Average daily value traded (€ m) |
1.2 |
1.2 |
|
Shares and market values |
|
|
|
Total number of shares (m) |
60.01 |
60.01 |
|
Treasury shares (k) |
189.5 |
10.9 |
|
Closing price (€) |
16.6 |
19.2 |
|
Market capitalization (€ m) |
997.4 |
1,152.3 |
|
|
|
|
- Consolidated financial statements
P&L
|
|
reported |
comparable |
|
comparable |
|
|
(in €m) |
Q1 2018 |
Q1 2018 |
Q1 2019 |
change |
change |
|
Convergent service revenues |
20.8 |
38.1 |
83.4% |
||
|
Mobile only service revenues |
149.9 |
154.4 |
3.0% |
||
|
Fixed only service revenues |
9.7 |
12.2 |
24.9% |
||
|
IT & Integration Service |
0.9 |
1.0 |
19.6% |
||
|
Retail service revenues |
181.3 |
205.7 |
13.5% |
||
|
Equipment sales |
32.2 |
31.4 |
-2.5% |
||
|
Incoming & visitor roaming |
59.3 |
61.4 |
3.5% |
||
|
MVNO |
12.5 |
0.4 |
-96.8% |
||
|
Other |
5.5 |
4.9 |
-10.3% |
||
|
Wholesale revenues |
77.4 |
66.8 |
-13.7% |
||
|
Other revenues |
15.8 |
14.4 |
-8.9% |
||
|
Revenues |
306.6 |
|
318.2 |
|
3.8% |
|
|
|
||||
|
Direct costs |
-144.3 |
-145.3 |
0.7% |
||
|
Labor costs |
-36.1 |
-36.9 |
2.2% |
||
|
Indirect costs |
-65.6 |
-78.0 |
18.9% |
||
|
|
|||||
|
EBITDAaL |
|
60.3 |
58.0 |
-3.8% |
|
|
% margin |
19.7% |
18.2% |
-144 bp |
|
|
|
|
|||||
|
Adjusted EBITDA |
60.6 |
|
|
|
|
|
% margin |
19.8% |
|
|||
|
|
|||||
|
Restructuring costs |
-1.4 |
-4.6 |
|||
|
Other operating income |
0.0 |
0.0 |
|||
|
Depreciation and amortization |
-57.7 |
-60.8 |
|||
|
Impairment of goodwill |
0.0 |
0.0 |
|||
|
Share of profits (losses) of associates |
0.0 |
0.0 |
|||
|
|
|
||||
|
EBIT |
1.6 |
|
-7.4 |
|
NM |
|
% margin |
0.5% |
-2.3% |
-284 bp |
||
|
|
|||||
|
Financial income |
0.0 |
0.0 |
|||
|
Financial expense |
-1.1 |
-1.1 |
|||
|
|
|||||
|
Profit before tax |
0.5 |
|
-8.5 |
|
|
|
|
|||||
|
Tax expense |
-0.9 |
0.1 |
|||
|
|
|||||
|
Net profit |
-0.4 |
-8.3 |
|||
|
|
|
|
|
|
|
Cash flow statement
|
(in €m ) |
Q1 2018 |
Q1 2019 |
|
Net profit |
-0.4 |
-8.3 |
|
Adjustments |
|
|
|
Tax expense |
0.9 |
-0.1 |
|
Net financial expense |
1.1 |
1.1 |
|
Share of profits (losses) of associates and joint ventures |
0.0 |
0.0 |
|
Impairment of goodwill |
0.0 |
0.0 |
|
Depreciation, amortization & impairment |
57.7 |
60.8 |
|
Gains (losses) on disposal |
0.0 |
0.0 |
|
Changes in provisions |
-12.0 |
2.1 |
|
Operating taxes and levies |
15.4 |
16.4 |
|
Share-based compensation |
0.0 |
-0.1 |
|
Impairment on trade and other receivables, including contract assets |
0.0 |
0.0 |
|
62.9 |
80.2 |
|
|
Changes in working capital requirements |
|
|
|
Decrease (increase) in inventories, gross |
-2.5 |
7.7 |
|
Decrease (increase) in trade receivables, gross |
12.3 |
-1.6 |
|
Increase (decrease) in trade payables |
12.5 |
5.0 |
|
Changes in other assets and liabilities |
-14.5 |
-0.9 |
|
Change in other assets related to contracts with customers |
1.1 |
0.4 |
|
Change in liabilities related to contracts with customers |
1.1 |
-1.2 |
|
10.1 |
9.4 |
|
|
Other net cash out |
|
|
|
Operating taxes and levies paid |
-10.9 |
-8.6 |
|
Interest paid and interest rates effects on derivatives, net |
-0.9 |
-1.0 |
|
Taxes paid |
0.0 |
1.2 |
|
-11.8 |
-8.4 |
|
|
Net cash provided by operating activities |
60.9 |
72.8 |
|
|
||
|
Purchase of property, plant and equipment & intangible assets |
-31.8 |
-36.9 |
|
Increase (decrease) in fixed assets payables |
-9.1 |
-23.5 |
|
Proceeds from disposal of property, plant and equipment & intangible assets |
0.0 |
0.0 |
|
Cash paid for investment securities and acquired businesses, net of cash acquired |
-1.8 |
0.0 |
|
Proceeds from sale of investment securities and businesses, net of cash sold |
0.0 |
0.0 |
|
Decrease (increase) in securities and other financial assets |
0.0 |
0.0 |
|
Net cash used in investing activities |
-42.7 |
-60.4 |
|
|
||
|
Long-term debt repayments |
-20.0 |
0.0 |
|
Long-term debt drawdown |
0.0 |
0.0 |
|
Increase (decrease) of bank overdrafts and short-term borrowings |
7.3 |
-13.6 |
|
Repayment of lease liabilities |
0.0 |
-10.9 |
|
Purchase of treasury shares |
-0.7 |
-0.2 |
|
Dividends paid |
0.0 |
0.0 |
|
Net cash used in financing activities |
-13.4 |
-24.7 |
|
|
||
|
Net change in cash and cash equivalents |
4.8 |
-12.3 |
|
|
||
|
Cash and cash equivalents |
|
|
|
Opening balance |
13.0 |
26.6 |
|
Closing balance |
17.8 |
14.3 |
|
|
|
|
Balance sheet
|
(in €m ) |
Q4 2018 |
Q1 2019 |
|
Goodwill |
67.0 |
67.0 |
|
Other intangible assets |
285.3 |
276.1 |
|
Property, plant and equipment |
772.3 |
756.3 |
|
RoU assets |
0.0 |
276.5 |
|
Inrterests in associates and joint-ventures |
4.4 |
4.4 |
|
Non-current financial assets |
2.5 |
6.1 |
|
Other non-current assets |
1.4 |
1.4 |
|
Deferred tax assets |
3.3 |
3.4 |
|
1,136.2 |
1,391.2 |
|
|
|
||
|
Inventories |
27.7 |
20.4 |
|
Trade receivables |
194.3 |
195.9 |
|
Current financial assets |
0.4 |
-3.2 |
|
Current derivative assets |
0.2 |
0.4 |
|
Other current assets |
2.7 |
2.5 |
|
Operating taxes and levies receivables |
1.9 |
1.6 |
|
Current tax assets |
0.1 |
0.3 |
|
Prepaid expenses |
11.4 |
22.3 |
|
Other assets related to contracts with customers |
61.8 |
61.3 |
|
Cash and cash equivalents |
26.6 |
25.2 |
|
326.9 |
326.7 |
|
|
|
||
|
ASSETS |
1,463.3 |
1,717.9 |
|
|
||
|
Share capital |
131.7 |
131.7 |
|
Legal reserves |
13.2 |
13.2 |
|
Retained earnings |
442.2 |
434.1 |
|
Treasury shares |
0.0 |
-0.2 |
|
Equity |
587.1 |
578.8 |
|
|
||
|
Non-current financial debt |
270.0 |
269.9 |
|
Non-current lease liabilities |
0.0 |
244.4 |
|
Non-current derivatives liabilities |
2.8 |
2.8 |
|
Non-current fixed assets payable |
0.0 |
0.0 |
|
Non-current employee benefits |
0.1 |
0.1 |
|
Non-current provisions for dismantling obligations |
63.2 |
63.4 |
|
Non-current restructuring provisions |
0.0 |
0.0 |
|
Other non-current liabilities |
1.9 |
1.8 |
|
Deferred tax liabilities |
8.1 |
8.1 |
|
Non-current liabilities |
346.2 |
590.6 |
|
|
||
|
Current financial debt |
20.8 |
7.3 |
|
Current lease liabilities |
0.0 |
30.0 |
|
Current derivatives liabilities |
0.2 |
0.3 |
|
Current fixed assets payable |
53.3 |
29.8 |
|
Trade payables |
266.6 |
271.6 |
|
Current employee benefits |
30.8 |
31.8 |
|
Current provisions for dismantling obligations |
1.2 |
1.0 |
|
Current restructuring provisions |
3.0 |
6.0 |
|
Other current liabilities |
3.5 |
2.1 |
|
Operating taxes and levies payables |
85.6 |
103.7 |
|
Current tax payables |
3.1 |
4.3 |
|
Liabilities related to contracts with customers |
59.4 |
58.2 |
|
Deferred income |
2.3 |
2.4 |
|
Current liabilities |
530.0 |
548.6 |
|
|
||
|
EQUITY AND LIABILITIES |
1,463.3 |
1,717.9 |
|
|
|
|
- Glossary
Financial KPIs
|
Revenues |
|
|
|
revenues in line with the offer |
Provide Group revenues split in convergent services, mobile only services, fixed only services, IT & integration services, wholesale, equipment sales and other revenues. |
|
|
retail service revenues |
Revenue aggregation of revenues from convergent services, mobile only services, fixed only services, IT & integration services. |
|
|
convergent services |
Revenues from B2C convergent offers (excluding equipment sales). A convergent offer is defined as an offer combining at least a broadband access (xDSL, FTTx, cable or Fixed-4G (fLTE) with cell-lock) and a mobile voice contract (excluding MVNOs). Convergent services revenues do not include incoming and visitor roaming revenues. |
|
|
mobile only services |
Revenues from mobile offers (excluding B2C convergent offers and equipment sales) and M2M connectivity, excluding incoming and visitors roaming revenues. |
|
|
fixed only services |
Revenues from fixed offers (excluding B2C convergent offers and equipment sales) including (i) fixed broadband, (ii) fixed narrowband, and (iii) data infrastructure, managed networks, and incoming phone calls to customer relations call centers. |
|
|
IT & integration services |
Revenues from collaborative services (consulting, integration, messaging, project management), application services (customer relationship management and infrastructure applications), hosting, cloud computing services, security services, video-conferencing and M2M services. It also includes equipment sales associated with the supply of these services. |
|
|
wholesale |
Revenues with third-party telecom operators for (i) mobile: incoming, visitor roaming, domestic mobile interconnection (i.e. network sharing and domestic roaming agreement) and MVNO, and for (ii) fixed carriers services. |
|
|
equipment sales |
Revenues from all mobile and fixed equipment sales, excluding (i) equipment sales associated with the supply of IT & Integration services, and (ii) equipment sales to dealers and brokers. |
|
|
other revenues |
Include (i) equipment sales to brokers and dealers, (ii) portal, on-line advertising revenues, (iii) corporate transversal business line activities, and (iv) other miscellaneous revenues. |
|
|
Profit & Loss |
|
|
|
Data on a comparable basis |
Data based on comparable accounting principles, scope of consolidation and exchange rates are presented for previous periods. The transition from data on an historical basis to data on a comparable basis consists of keeping the results for the period ended and then restating the results for the corresponding period of the preceding year for the purpose of presenting, over comparable periods, financial data with comparable accounting principles, scope of consolidation and exchange rate. The method used is to apply to the data of the corresponding period of the preceding year, the accounting principles and scope of consolidation for the period just ended as well as the average exchange rate used for the income statement for the period ended. Changes in data on a comparable basis reflect organic business changes. Data on a comparable basis is not a financial aggregate as defined by IFRS and may not be comparable to similarly-named indicators used by other companies. |
|
|
EBITDAaL (since 1 January 2019) |
EBITDA after lease is not a financial measure as defined by IFRS. It corresponds to the net profit before: taxes; net interest expense excluding financial leases; share of profit/losses from associates; impairment of goodwill and fixed assets; effects resulting from business combinations; reclassification of cumulative translation adjustment from liquidated entities; depreciation and amortization; the effects of significant litigation, specific labor expenses; review of the investments and business portfolio, restructuring costs. |
|
|
reported EBITDA (prior to 31 December 2018) |
Reported EBITDA corresponds to the operating income before depreciation and amortization, before effects resulting from business combinations, before reclassification of cumulative translation adjustment from liquidated entities, before impairment of goodwill and fixed assets, and before share of profits (losses) of associates. |
|
|
adjusted EBITDA (prior to 31 December 2018) |
Adjusted EBITDA (previously Restated EBITDA) corresponds to the reported EBITDA adjusted for the effects of significant litigation, specific labor expenses, review of the investments and business portfolio, restructuring costs and, where appropriate, other specific items. |
|
|
Cash flow statement |
||
|
operating cash flow |
Adjusted EBITDA minus eCapex. |
|
|
eCapex (since 1 January 2019) |
Economic Capex is not a financial measure as defined by IFRS. It corresponds to capital expenditures on tangible and intangible assets excluding telecommunication licenses and excluding investments through financial leases less proceeds from the disposal of fixed and intangible assets. |
|
|
licences & spectrum |
Cash out related to acquisitions of licences and spectrum. |
|
|
change in WCR |
Change in net inventories, plus change in gross trade receivables, plus change in trade payables, plus change in other elements of WCR. |
|
|
other operational items |
Mainly offset of non-cash items included in adjusted EBITDA, items not included in adjusted EBITDA but included in net cash provided by operating activities, and change in fixed asset payables. |
|
|
net debt variation |
Variation of net debt level. |
|
Operational KPIs
|
Convergent |
|
|
B2Cconvergent customer base |
Number of B2C customers holding an offer combining at least a broadband access (xDSL, FTTx, cable or Fixed-4G (fLTE) with cell-lock) and a mobile voice contract (excluding MVNOs). |
|
B2C convergent ARPO |
Average quarterly Revenues Per Offer (ARPO) of convergent services are calculated by dividing (a) the revenues from convergent offers billed to the B2C customers (excluding equipment sales) over the past three months, by (b) the weighted average number of convergent offers over the same period. The weighted average number of convergent offers is the average of the monthly averages during the period in question. The monthly average is the arithmetic mean of the number of convergent offers at the start and end of the month. Convergent ARPO is expressed as monthly revenues per convergent offer. |
|
Mobile |
|
|
mobile customer base (excl. MVNOs) |
Number of customers with active simcard, including (i) M2M and (ii) business and internet everywhere (excluding MVNOs). |
|
contract |
Customer with whom Orange has a formal contractual agreement with the customer billed on a monthly basis for access fees and any additional voice or data use. |
|
prepaid |
Customer with whom Orange has written contract with the customer paying in advance any data or voice use by purchasing vouchers in retail outlets for example. |
|
M2M (machine-to-machine) |
Exchange of information between machines that is established between the central control system (server) and any type of equipment, through one or several communication networks. |
|
mobile B2C convergent customers |
Number of mobile lines of B2C convergent customers. |
|
mobile only customers |
Number of mobile customers (see definition of this term) excluding mobile convergent customers (see definition of this term). |
|
MVNO customers |
Hosted MVNO customers on Orange networks. |
|
mobile only ARPO (quarterly) |
Average quarterly Revenues Per Offer (ARPO) of mobile only services are calculated by dividing (a) the revenues of mobile only services billed to the customers, generated over the past three months, by (b) the weighted average number of mobile only customers (excluding M2M customers) over the same period. The weighted average number of customers is the average of the monthly averages during the period in question. The monthly average is the arithmetic mean of the number of customers at the start and end of the month. Mobile only ARPO is expressed as monthly revenues per customer. |
|
|
|
|
number of lines (copper + FTTH) |
Number of fixed lines operated by Orange. |
|
B2C broadband convergent customers |
Number of B2C customers holding an offer combining at least a broadband access (xDSL, FTTx, cable or Fixed-4G (fLTE) with cell-lock) and a mobile voice contract (excluding MVNOs). |
|
fixed broadband only customers |
Number of fixed broadband customers excluding broadband convergent customers (see definition of this term). |
|
fixed only broadband ARPO (quarterly) |
Average quarterly Revenues Per Offer (ARPO) of fixed only broadband services (xDSL, FTTH, Fixed-4G (fLTE), satellite and Wimax) are calculated by dividing (a) the revenues from consumer fixed only broadband services over the past three months, by (b) the weighted average number of accesses over the same period. The weighted average number of accesses is the average of the monthly averages during the period in question. The monthly average is the arithmetic mean of the number of accesses at the start and end of the month. ARPO is expressed as monthly revenues per access. |
Consolidation perimeter
The consolidation perimeter has not changed since 31 December 2018 and includes Orange Belgium S.A. (100 %), Orange Communications Luxembourg S.A. (100 %), Smart Services Network S.A. (100 %), IRISnet S.C.R.L. (accounted for by equity method - 28.16 %), Walcom S.A. (100 %), Walcom Business solutions S.A. (100 %), Walcom Liège S.A. (100 %), A3COM S.A. (100 %) and A&S Partners S.A. (100 %).
Rounding
Due to rounding, numbers presented may not add up precisely to the totals provided and percentages may not precisely reflect the absolute figures.
About Orange Belgium
Orange Belgium is one of the leading telecommunication operators in the Belgian market, with over 3m customers, and in Luxembourg through its subsidiary Orange Communications Luxembourg.
As a convergent actor, we provide mobile telecommunication services, internet and TV to private clients, as well as innovative mobile and fixed line services to businesses. Our high-performance mobile network supports 2G, 3G, 4G and 4G+ technology and is the subject of ongoing investments.
Orange Belgium is a subsidiary of Orange Group, one of the leading European and African operators of mobile telephony and internet access, as well as one of the world leaders for telecommunication services to enterprises.
Orange Belgium is listed on the Brussels Stock Exchange (OBEL).
More information on: corporate.orange.be, www.orange.be or follow us on Twitter: @pressOrangeBe.
Investors contact
Ana Castaño Lopez +32 468 46 95 31
Eric Chang +32 495 55 98 17
Press contact
Isabelle Vanden Eede (FR) – isabelle.vandeneede@orange.com +32 474 77 77 28